
Pivot Tables and Charts in Excel
66.000 د.ع
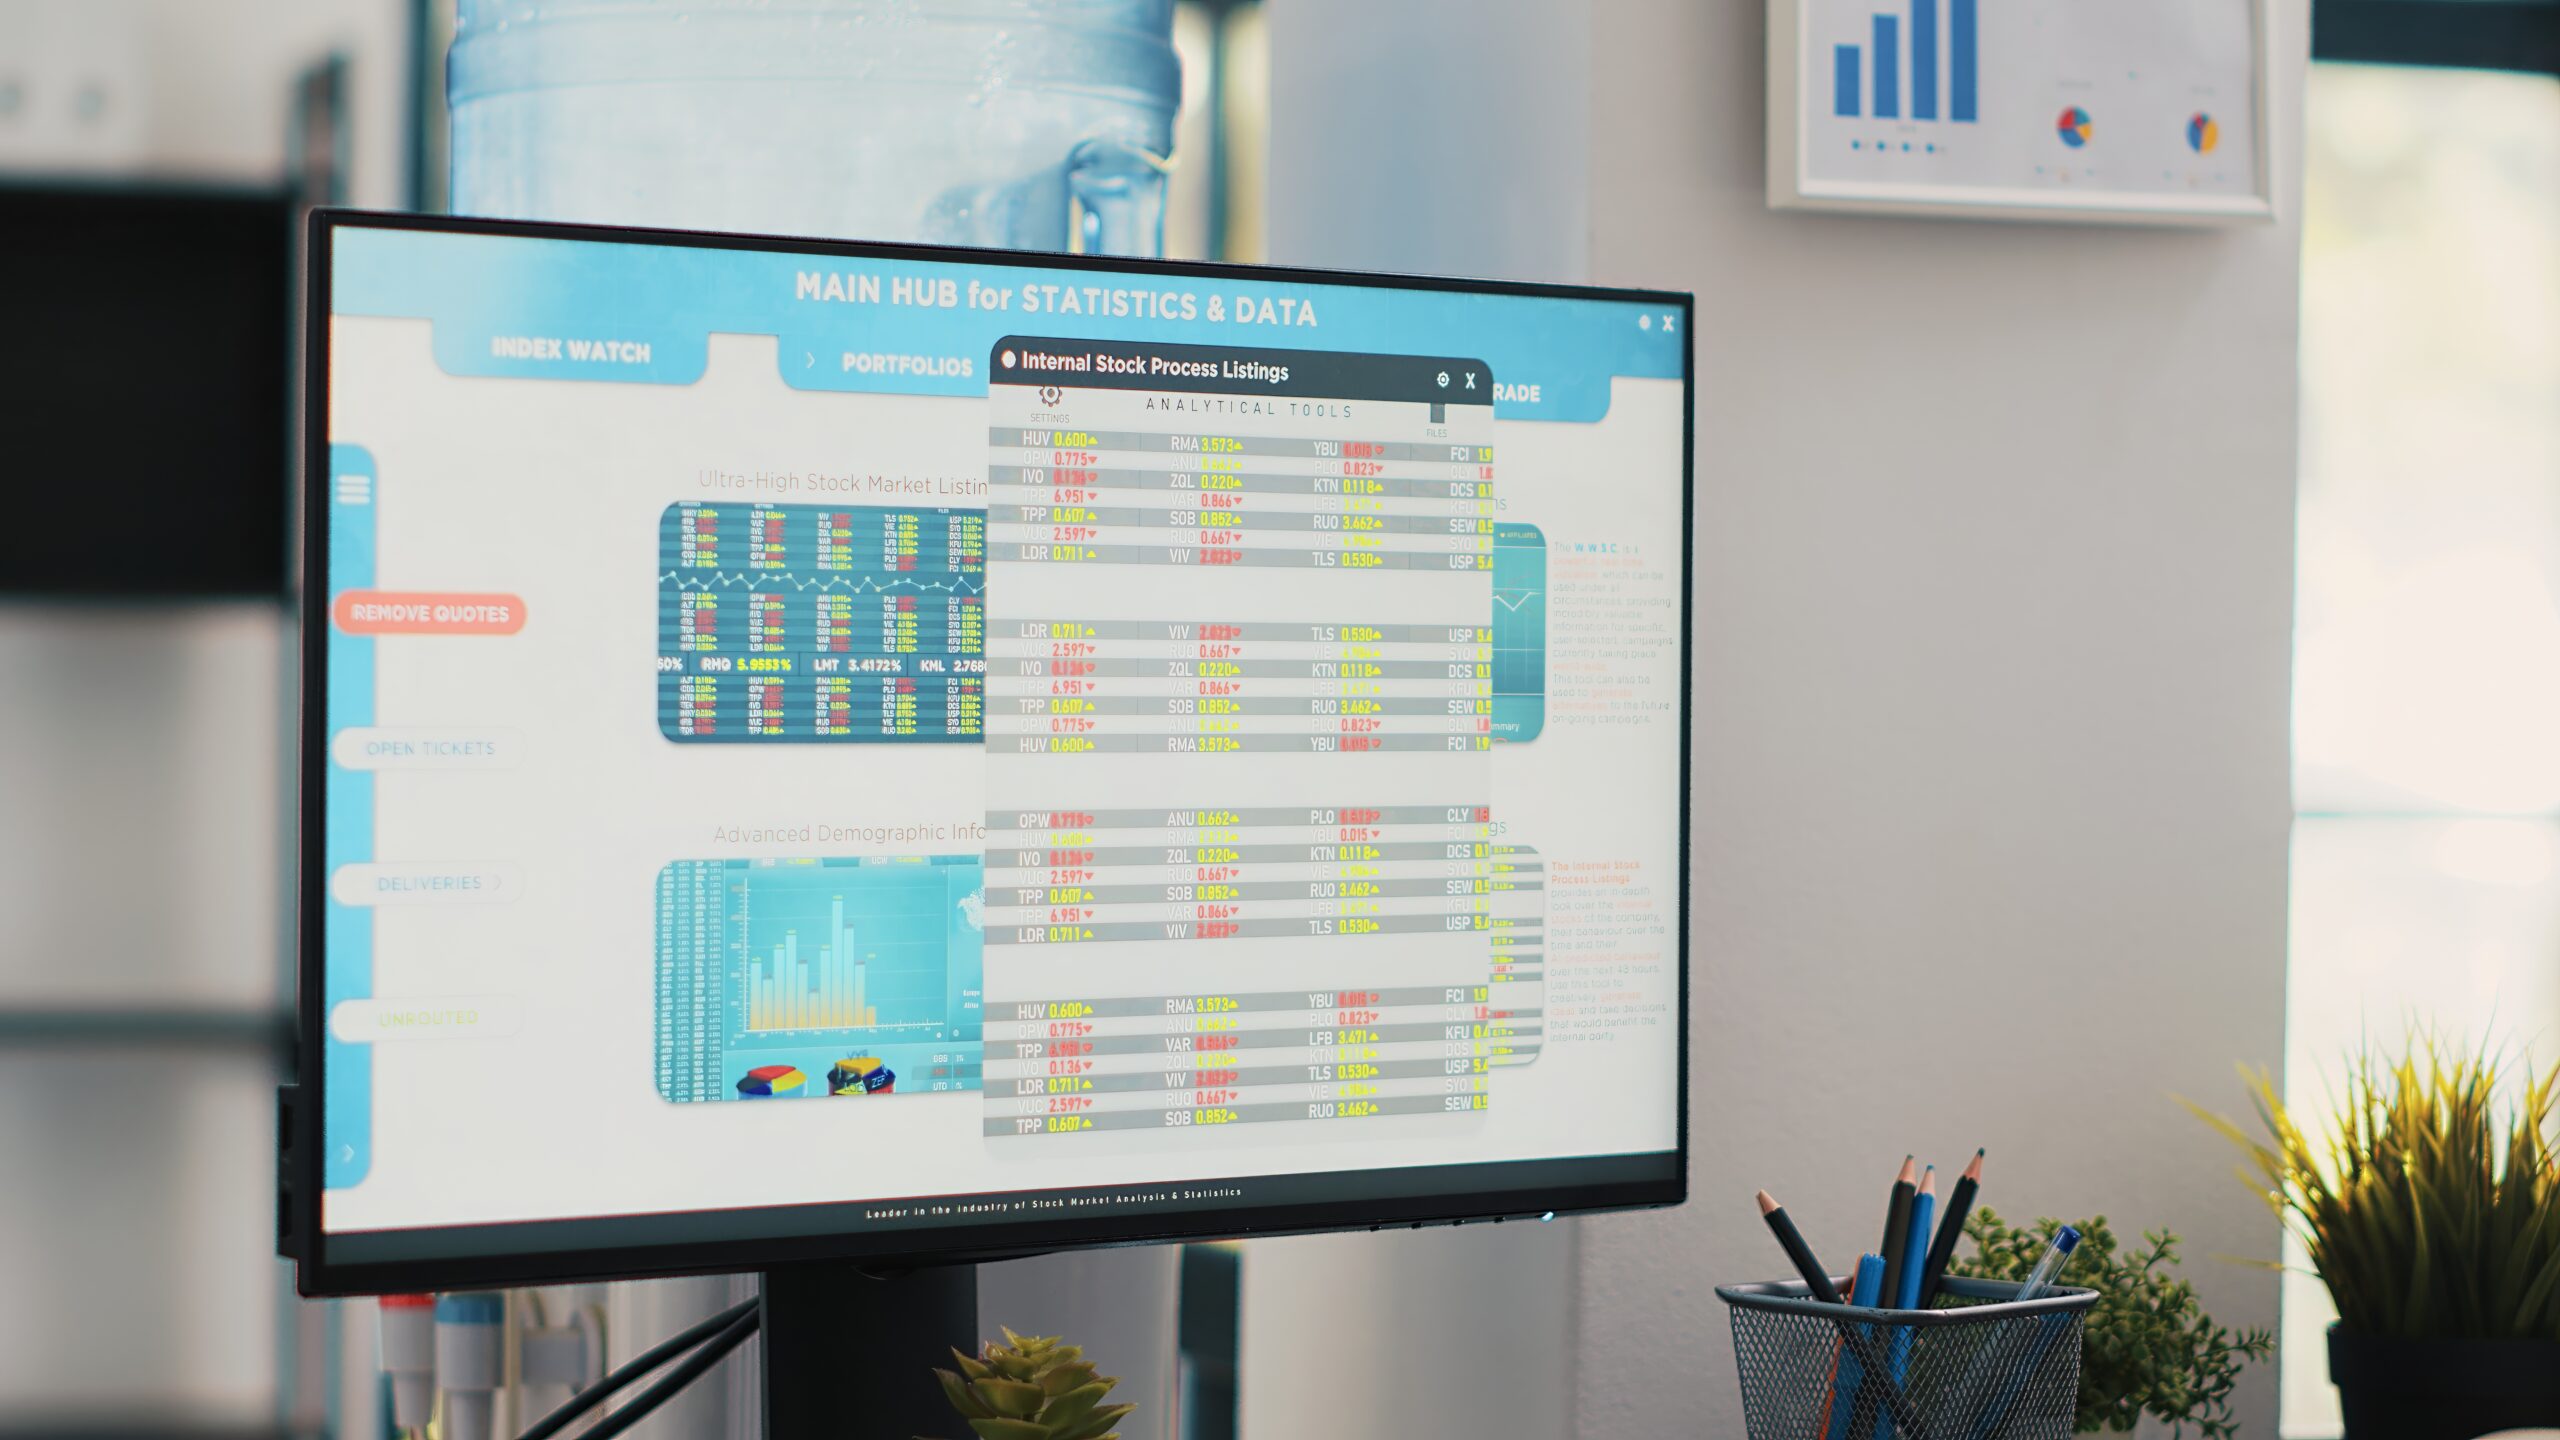
![]()
Description
Overview
This course is designed to empower learners with the skills necessary to create and utilize pivot tables and charts in Excel, transforming complex data into understandable, actionable insights. Whether you are working with financial data, managing inventories, or tracking performance metrics, pivot tables and charts are powerful tools that can help you summarize and analyze data efficiently. You will learn how to organize and filter data, perform calculations, and visually represent trends with charts. The course offers practical exercises that will allow you to apply these concepts to real-world scenarios, making your work more efficient and data-driven. By the end of this course, you will confidently manipulate large datasets, extract meaningful insights, and present them visually to stakeholders, all within Excel.
Learning Outcomes
- Create and manage pivot tables to summarize data.
- Apply filters and sorting techniques for efficient data analysis.
- Use calculated fields and values to perform advanced data analysis.
- Design pivot charts for a clear visual representation of data trends.
- Apply practical Excel tools to enhance productivity and decision-making.
Description
This course delves into the essentials of using pivot tables and charts in Excel, from understanding the basic functionalities to mastering advanced techniques. Through step-by-step tutorials, you will explore data summarization, grouping, filtering, and visualization, all within Excel’s powerful pivot table and chart features. Whether you are a beginner or looking to refine your skills, this course will provide you with the hands-on experience needed to work smarter with your data, presenting insights clearly and effectively.
Who is this course for?
This course is ideal for professionals, analysts, and students who work with large datasets and need to extract meaningful insights. It is suitable for anyone looking to improve their Excel skills and gain confidence in data analysis and reporting.
Career Path
Upon completing this course, you can pursue roles such as Data Analyst, Business Analyst, Financial Analyst, and any profession that involves data management, analysis, and reporting using Excel.
Curriculum
- Visualizing Data with Charts
- Create Charts (00:13:00)
- Modify and Format Charts (00:12:00)
- Use Advanced Chart Features (00:13:00)
- Create a Trendline (00:00:00)
- Create Advanced Charts (00:00:00)
- Using PivotTables and PivotCharts
- Create a PivotTable (00:13:00)
- Analyze PivotTable Data (00:12:00)
- Present Data with PivotCharts (00:08:00)
- Filter Data by Using Timelines and Slicers (00:11:00)
- Analyze Data with PivotCharts (00:00:00)
- Present PivotTable Data Visually (00:00:00)
- Using Lookup Functions and Formula Auditing
- Use Lookup Functions (00:13:00)
- Trace Cells (00:09:00)
- Watch and Evaluate Formulas (00:09:00)
- Activities
- Activities-Pivot Tables and Charts in Excel (00:00:00)


Reviews
There are no reviews yet.